What Is the Bloomberg US Dynamic Balance Index II (BXIIUDB2)?
The Bloomberg US Dynamic Balance Index II (ticker: BXIIUDB2) is a volatility-managed, multi-asset index used as a crediting strategy in several Allianz fixed index annuities. It shifts between U.S. equities and U.S. bonds based on market volatility. It raises bond exposure when markets get choppy. It adds equity exposure when conditions are calmer.
If you own or are considering an Allianz annuity like the Allianz 222, Accumulation Advantage+, or Core Income 7, this index is likely one of your crediting strategy options. Here’s how it works and whether it’s worth selecting.
What Is the Bloomberg US Dynamic Balance Index II?
The Bloomberg US Dynamic Balance Index II is a rules-based index that blends two asset classes, U.S. large-cap equities and U.S. investment-grade bonds, and automatically adjusts the weighting between them every day based on recent market volatility. It was established on August 14, 2015 and targets 5% annualized volatility.
The two underlying components are:
- Bloomberg US Equity Custom Futures ER Index, tracks futures on large-cap U.S. equities, similar to S&P 500 futures
- Bloomberg US Aggregate Custom RBI Unfunded Index, tracks futures prices on the Bloomberg US Aggregate Bond Index, a benchmark for the U.S. investment-grade bond market
The index uses an excess return (ER) methodology, meaning it tracks the price of futures contracts rather than the spot index. This structure helps stabilize participation rates from year to year by reducing the impact of short-term interest rate changes on renewal rates, a meaningful advantage for long-term annuity holders.
How Does the Dynamic Allocation Work?
Every day, the index measures the S&P 500’s realized volatility over 20-day and 40-day periods. It uses the higher value. It does the same for the bond component. These volatility figures determine how much weight goes to equities vs. bonds.
The key rules:
- When equity volatility is low, the index allocates more to equities (higher growth potential)
- When equity volatility is high, the index shifts toward bonds (capital preservation)
- During extreme volatility, the combined weights may fall below 100%, effectively moving to a partial cash position
- Allocation weights can change by up to 3% per day, preventing whipsaw from sudden moves
There is no human discretion involved. The allocation is entirely algorithmic, which removes the behavioral risk of a fund manager chasing yield or panic-selling. The index follows its rules regardless of headlines.
How Does It Perform Inside an Allianz Annuity?
You don’t invest directly in this index. Instead, you select it as a crediting strategy inside an Allianz fixed index annuity. The annuity uses the index’s annual performance to calculate your interest credit, subject to a cap or spread.
The Bloomberg US Dynamic Balance II is available with an annual point-to-point crediting method, which measures the index value at the start and end of each contract year. You can typically choose between:
| Crediting Method | How It Works |
|---|---|
| Annual PTP with Cap | You receive 100% of the index return up to a maximum cap rate (e.g., if the cap is 6% and the index returns 8%, you get 6%) |
| Annual PTP with Spread | The carrier subtracts a fixed spread from the index return (e.g., if the spread is 2% and the index returns 8%, you get 6%) |
In both cases, if the index finishes the year negative, you receive 0%, your principal is protected. That’s the fundamental trade-off of a fixed index annuity: you give up some upside potential in exchange for a guaranteed floor.
Which Allianz Annuities Offer This Index?
The Bloomberg US Dynamic Balance Index II is available as a crediting strategy in these Allianz products:
- Allianz 222 Annuity, popular for its dual income rider buckets and no explicit annual rider charges
- Allianz Accumulation Advantage+, focused on growth potential with competitive caps and participation rates
- Allianz Core Income 7, designed for income with a built-in GLWB rider
- Allianz Benefit Control, flexible index options with benefit control features
For Allianz’s full product lineup, AM Best ratings, and company overview, see our Allianz Life Annuity Review.
Historical Allocation Behavior
The chart below shows how the Bloomberg US Dynamic Balance Index II would have allocated between equities and bonds over a 14-year backtested period (2005–2019):
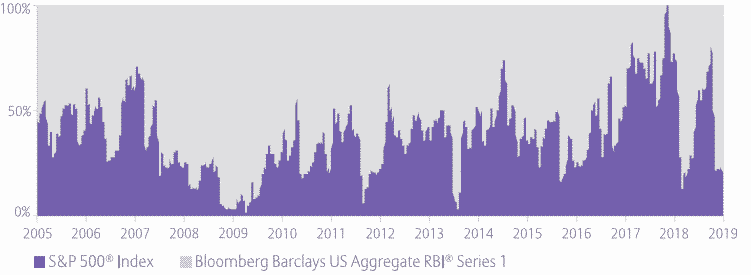
Notice the shift during the 2008 financial crisis, the index would have moved to nearly 100% bonds as equity volatility spiked. This is exactly the behavior the index is designed for: reducing equity exposure during turbulent periods and gradually adding it back as markets stabilize.
Hypothetical Returns Inside an Allianz Annuity
The chart below shows what hypothetical returns would have looked like inside an Allianz annuity using the Bloomberg US Dynamic Balance Index II with both cap and spread crediting methods over a 14-year backtested period:
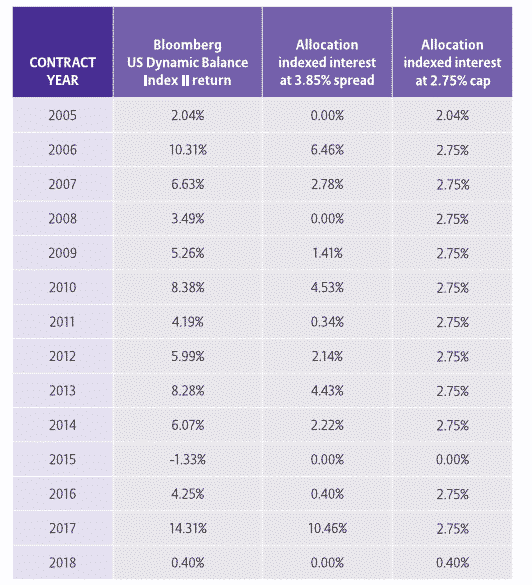
This assumes the Allianz annuity was issued on 1/1/2005 using current caps and spreads applied retroactively. The annuity was not available during this entire period. Actual caps and spreads over this timeframe would have been different. Past hypothetical results are not a guarantee of future performance.
Bloomberg US Dynamic Balance II vs. Other Volatility-Controlled Indexes
How does this index compare to other volatility-managed indexes you’ll find in fixed index annuities?
| Index | Asset Class | Vol Target | Rebalancing |
|---|---|---|---|
| Bloomberg US Dynamic Balance II | Equity + Bonds | 5% | Daily |
| Nasdaq FC (BOFANFCC) | Equity only (Nasdaq-100) | 12.5% | Hourly |
| S&P 500 Daily Risk Control 5% | Equity only (S&P 500) | 5% | Daily |
| BNP Paribas Multi Asset Diversified 5 | Multi-asset | 5% | Daily |
The Bloomberg Dynamic Balance II is more conservative than the Nasdaq FC, which targets 12.5% volatility and can apply up to 175% leverage. The Dynamic Balance approach, blending equities with investment-grade bonds rather than just adjusting leverage on a single equity index, tends to produce smoother returns with smaller drawdowns, but also lower peaks in strong bull markets.
For a deeper look at how the Nasdaq FC Index compares, see our Nasdaq FC Index (BOFANFCC) review.
Should You Choose This Index in Your Annuity?
The Bloomberg US Dynamic Balance Index II is a good fit if you:
- Prefer a more conservative approach, the 5% volatility target and bond allocation provide a smoother ride than equity-only indexes
- Want built-in diversification, the automatic equity/bond blend means you don’t need to manually split your allocation
- Value consistency, the excess return structure helps stabilize participation rates at renewal, so your crediting terms are less likely to change dramatically year to year
- Are using an income-focused product, if you’re in an annuity like the Allianz Core Income 7 where steady accumulation matters more than maximum growth, this index fits the strategy
It may not be the best choice if you’re looking for maximum growth potential and are comfortable with higher volatility. In that case, an equity-focused index with a higher vol target may deliver better results in strong markets, though with wider swings.
Most advisors recommend splitting your allocation across 2-3 crediting strategies rather than concentrating in one index. Not sure which mix is right for you? Request a free quote and we’ll help you compare options.
Frequently Asked Questions
What is the Bloomberg US Dynamic Balance Index II?
The Bloomberg US Dynamic Balance Index II (BXIIUDB2) is a volatility-managed index that dynamically allocates between U.S. equity futures and U.S. investment-grade bond futures based on recent market volatility. It targets 5% annualized volatility and rebalances daily. It’s used as a crediting strategy option inside certain Allianz fixed index annuities.
Can you lose money with this index in an annuity?
No, if the Bloomberg US Dynamic Balance Index II returns a negative number over your annual crediting period, your annuity receives 0% for that year. Your principal is protected from market losses. However, early withdrawals may be subject to surrender charges.
What’s the difference between a cap and a spread?
A cap sets a ceiling on your credited return (you receive 100% of the index gain up to the cap). A spread subtracts a fixed percentage from the index gain (you keep whatever is left after the spread is deducted). Caps perform better in moderate-return years; spreads can outperform in high-return years since there’s no ceiling. For more on how crediting methods work, see our FIA cap rates page.
Why does the index use an “excess return” methodology?
Excess return indexes track futures prices rather than the spot index value. Futures prices already account for expected dividends and interest rates, which removes some variables from the options pricing that carriers use to fund your crediting strategy. The result: more stable participation rates at annual renewal, so your crediting terms are less likely to swing dramatically from year to year.
Is this index better than the S&P 500 for my annuity?
They serve different purposes. The Bloomberg Dynamic Balance II offers built-in equity/bond diversification with lower volatility, which tends to produce steadier returns. A raw S&P 500 strategy gives you pure equity exposure but typically comes with lower participation rates or tighter caps because of higher options costs. Many annuity owners allocate across both. For broader guidance on how fixed index annuities work, see our beginner’s guide.


