Who are the Best Fixed Index Annuity Companies?
Fixed Index Annuities have increased in popularity over the last five years resulting in many more top-rated annuity companies entering the market. In this article, we’ll list the top ten best ixed indexed annuity companies based on total sales in 2022.
So without further ado let’s get started.
The Top 10 Fixed Indexed Annuity Companies
Best Fixed Indexed Annuity Companies by the Numbers
Each year the Secure Retirement Institute publishes total U.S. Individual Fixed Annuity Sales and breaks out the results for the top 20 Annuity Companies.
In addition to overall annuity sales they also break out the results into variable annuity, fixed annuity, and fixed index annuity sales.
UPDATED 3/18/23: Athene Life and Annuity Company was the number one fixed-indexed annuity company in 2022 for the third consecutive year; based on total U.S Individual Fixed Index Annuity Sales.
Total fixed index annuity sales were $79.4 billion in 2022, up 25% from 2021, and 8% higher than the record set in 2019.
The table below lists the 10 best-fixed index annuity companies based on U.S. Individual Fixed Index Annuity Sales (sales results are in Billions).
| Rank | Company name | Indexed |
|---|---|---|
| 1 | Athene Annuity and Life | $10,069,119 |
| 2 | Allianz Life | $8,193,195 |
| 3 | Corebridge Financial | $6,689,473 |
| 4 | Sammons Financial Companies | $5,567,141 |
| 5 | Fidelity & Guaranty Life | $4,550,211 |
| 6 | Mass Mutual | $4,375,100 |
| 7 | Global Atlantic Financial Group | $4,151,070 |
| 8 | Nationwide | $3,984,900 |
| 9 | Security Benefit Life | $3,373,386 |
| 10 | American Equity | $3,164,399 |
Source: Secure Retirement Institute* U.S. Individual Annuities Sales Survey
Best Fixed Index Annuity Companies Since 2015
Allianz Life, Athene, and AIG are the best-fixed index annuity companies. What I think is quite telling is each of these three has been in the top five each of the last five years, as you see in the table below.
| Annuity Company | 2020 | 2019 | 2018 | 2017 | 2016 |
|---|---|---|---|---|---|
| Allianz | 2 | 1 | 1 | 1 | 1 |
| Athene | 1 | 2 | 2 | 2 | 3 |
| AIG | 3 | 3 | 4 | 4 | 5 |
| Nationwide | 7 | 4 | 3 | 3 | 7 |
| American Equity | 9 | 5 | 6 | 6 | 2 |
While I realize making a blanket statement that the annuity companies with the most fixed index annuity sales are the best annuity companies; in this case, it is my belief the numbers don’t lie. At least for the top four out of five spots.
The best annuity for you will be determined by your individual goals and objectives, but generally speaking, Allianz, Athene and AIG are the best fixed index annuity companies.
My Annuity Store, Inc. Tweet
10 Best Fixed Index Annuity Companies

#1. Allianz Life
| Allianz Life | Rating |
|---|---|
| 5701 Golden Hills Dr., Minneapolis, MN 55416 | |
| A.M. Best Rating | A+ |
| Moody's (21 rankings) | A1 (5) |
| Comdex (percentile of all rated companies) | 94 |
| Standard & Poor's (20 Possible Ratings) | AA (3) |

#2. Athene
| Athene Financial Ratings | Rating |
|---|---|
| 7700 Mills Civic Parkway, West Des Moines, IA 50266 | |
| A.M. Best Rating (15 possible ratings) | A (3) |
| Fitch Ratings (21 possible) | A (6) |
| Comdex (percentile of all rating companies) | 78 |
| Standard & Poor's (20 possible ratings) | A (6) |

#3. AIG
| American General Life Insurance Company | Rating |
|---|---|
| A.M. Best Company (Best's Ratings, 15 Ratings) | A (3) |
| Moody's (Financial Strength, 21 Ratings) | A2 (6) |
| Standard & Poor's (Financial Strength, 20 Ratings) | A+ (5) |
| Fitch Ratings (Financial Strength, 21 Ratings) | A+ (5) |
| Weiss (Safety Rating, 16 Ratings) | B (5) |
| Comdex Ranking (Percentile in Rated Companies) | 82 |

#5. American Equity
| American Equity | Rating |
|---|---|
| 6000 Westown Pkwy, West Des Moines, IA 50266 | |
| A.M. Best Rating (15 possible ratings) | A- (4) |
| Fitch (21 possible ratings) | A- (7) |
| Standard & Poor's (Financial Strength, 20 Ratings) | A- (7) |
| Comdex (percentile of all rating companies) | 60 |

#6. Lincoln Financial
| Lincoln Financial Group | Rating |
|---|---|
| 1300 South Clinton St., Fort Wayne, IN 46802 | |
| A.M. Best Rating (15 possible ratings) | A+ (2) |
| Moody's (21 possible ratings) | A1 (5) |
| Fitch (21 possible ratings) | A+ (5) |
| Standard & Poor's (Financial Strength, 20 Ratings) | AA- (4) |
| Comdex (percentile of all rating companies) | 90 |

#7. Jackson National
| Jackson National Life Insurance Company | Rating |
|---|---|
| 1 Corporate Way, Lansing, MI 48951 | |
| A.M. Best Rating (15 possible ratings) | A (3) |
| Moody's (21 possible ratings) | A1 (5) |
| Fitch (21 possible ratings) | A+ (5) |
| Standard & Poor's (Financial Strength, 20 Ratings) | A+ (5) |
| Comdex (percentile of all rating companies) | 84 |
#1 Annuity: Jackson National MarketProtector Annuity

#8. Global Atlantic
| Global Atlantic Financial Group | Rating |
|---|---|
| A.M. Best Rating (15 possible ratings) | A (3) |
| Moody's (21 possible ratings) | A3 (7) |
| Fitch (21 possible ratings) | A (6) |
| Standard & Poor's (Financial Strength, 20 Ratings) | A- (7) |
| Comdex (percentile of all rating companies) | 75 |
#1 Annuity: Global Atlantic 150+SE

#9. Pacific Life
| Pacific Life Insurance Company | Rating |
|---|---|
| 700 Newport Center Dr, Newport Beach, CA 92660 | |
| A.M. Best Rating (15 possible ratings) | A+ (2) |
| Moody's (21 possible ratings) | A1 (5) |
| Fitch (21 possible ratings) | AA- (4) |
| Standard & Poor's (Financial Strength, 20 Ratings) | AA- (4) |
| Comdex (percentile of all rating companies) | 93 |
#1 Annuity: Pacific Index Edge

#10. Great American
| Great American Life Insurance Company | Rating |
|---|---|
| 301 E Fourth St., Cincinnati, OH 45202 | |
| A.M. Best Rating (15 possible ratings) | A+ (2) |
| Moody's (21 possible ratings) | A2 (6) |
| Standard & Poor's (20 possible ratings) | A+ (5) |
| Comdex (percentile of all rated companies) | 82 |
#1 Annuity: Great American Legend 7
Request an Annuity Quote
Complete the form below to get an annuity quote within 4 business hours. If urgent, you may reach us at 855-583-1104.
You can shop and compare fixed annuity rates here if you are looking for them instead.
Best Fixed Index Annuity Rates 2025
This list of best fixed index annuity rates is based on the highest S&P 500 annual point-to-point with a cap crediting strategy.
There are many other indexes and crediting options available; too many to list them here in a single table.
Visit our index annuity online store to view more best fixed index annuity rates for 2023.
| Insurer | Annuity | Rating | Cap | Term | |
|---|---|---|---|---|---|
| American Equity | FlexShield 10 | A- | 17% | 10 Years |

| SILAC | Denali 14 | B+ | 15.00% | 14 Years |

| SILAC | Denali 10 | B+ | 15.00% | 10 Years |

| GILICO | WealthChoice 10 | B+ | 12.00% | 10 Years |
| Nassau | Growth Annuity 10 | B+ | 11.25% | 10 Yrs | |

| SILAC | Denali 7 | B+ | 11.00% | 7 Years |

| AIG | Power 7 Protector | A | 10.75% | 7 Years |
| Athene | Performance Elite 7 | A | 10.00% | 7 Years |
Best Annuity Companies
| Rank | Company name | Total |
|---|---|---|
| 1 | New York Life | 23,244,645 |
| 2 | Athene | 20,689,767 |
| 3 | AIG Companies | 20,161,494 |
| 4 | Massachusetts Mutual Life | 18,795,460 |
| 5 | Equitable Financial | 15,158,901 |
| 6 | Jackson National | 14,899,969 |
| 7 | Allianz Life Insurance Company | 14,069,689 |
| 8 | Lincoln Financial Group | 12,101,204 |
| 9 | Pacific Life | 11,447,346 |
| 10 | Nationwide | 11,140,200 |
| 11 | Brighthouse | 10,960,124 |
| 12 | Global Atlantic Financial Group | 9,463,892 |
| 13 | Sammons Financial Companies | 8,611,720 |
| 14 | Fidelity & Guaranty Life | 8,294,766 |
| 15 | Western Southern Group | 7,757,264 |
| 16 | TIAA | 7,626,446 |
| 17 | Symetra Financial | 6,123,094 |
| 18 | Prudential Annuities | 6,116,206 |
| 19 | USAA Life | 5,972,015 |
| 20 | Security Benefit Life | 4,502,972 |
What is a Fixed Index Annuity?
A fixed index annuity is a type of fixed annuity that credits interest based on the performance of an external market index rather than a guaranteed annuity rate.
An indexed annuity offers an opportunity to earn more interest when the markets perform and provide downside protection from a potential market downturn.
NOTE: You may also hear fixed index annuities referred to as:
- FIA
- Equity Indexed Annuity
- EIA
- Hybrid Annuity
- Indexed Annuity
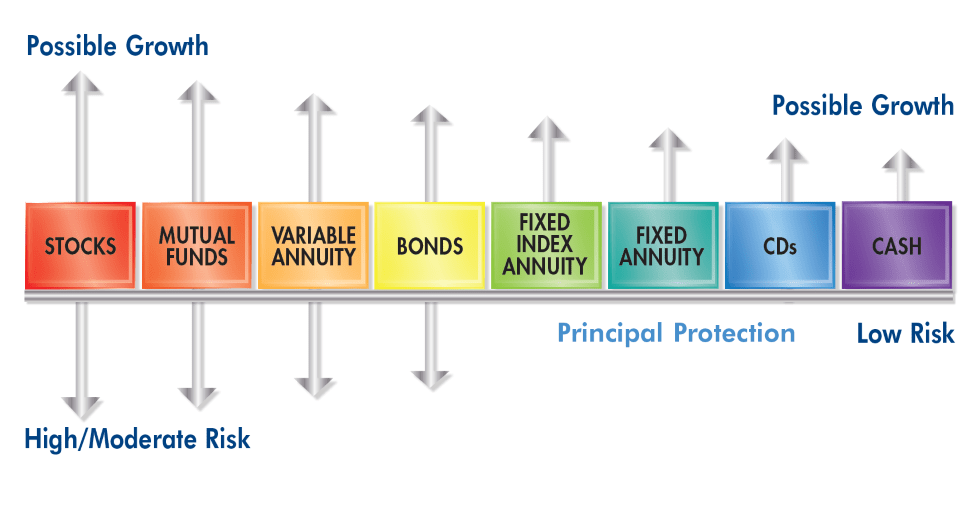
The below infographic illustrates where a fixed index annuity falls between a fixed annuity and variable annuity as well as other investment vehicles on the investment continuum.
Indexed annuities have increased in popularity largely because they offer the most growth potential of any investment that provides principal protection; especially where today’s CD rates are at.
How Do Fixed Index Annuities Work?
The amount of interest you will earn in a fixed index annuity is based on the performance of an external stock market index.
You are not directly investing in the stock market and you can not lose money in a fixed index annuity due to stock market declines.
Crediting Methods and factors are then applied to the index performance to determine your interest rate.
Annual Point to Point Crediting Method
Annual point to point uses the index value from only two points in time making it simple and straightforward to calculate.
Calculating index performance using the annual point-to-point method:
- Subtract the index at the end of the term from the value at the beginning of the term.
- If you have a positive number then the index has performed and you divide it by the starting value to get the percent increase.
Step #1: 107,000(end) – 100,000(initial) = 7,000 positive changes in the index value.
Step #2: 7,000 (end) / 100,000(initial) = 7% index performance.
Applying the Crediting Factors
There is three fixed index annuity crediting methods available in index annuities:
- Spread (Assume 2%)- index’s increase (7%) – spread (2%) = 5% interest earned.
- Cap – (Assume 5%) 100% of the index’s increase (7%) up to the cap(5%) = 5% interest earned.
- Participation Rate – (Assume 50%) The index’s increase 7% X (50%) = 3.50% (the participation rate) = interest earned.
Fixed Index Annuity vs. Variable Annuity
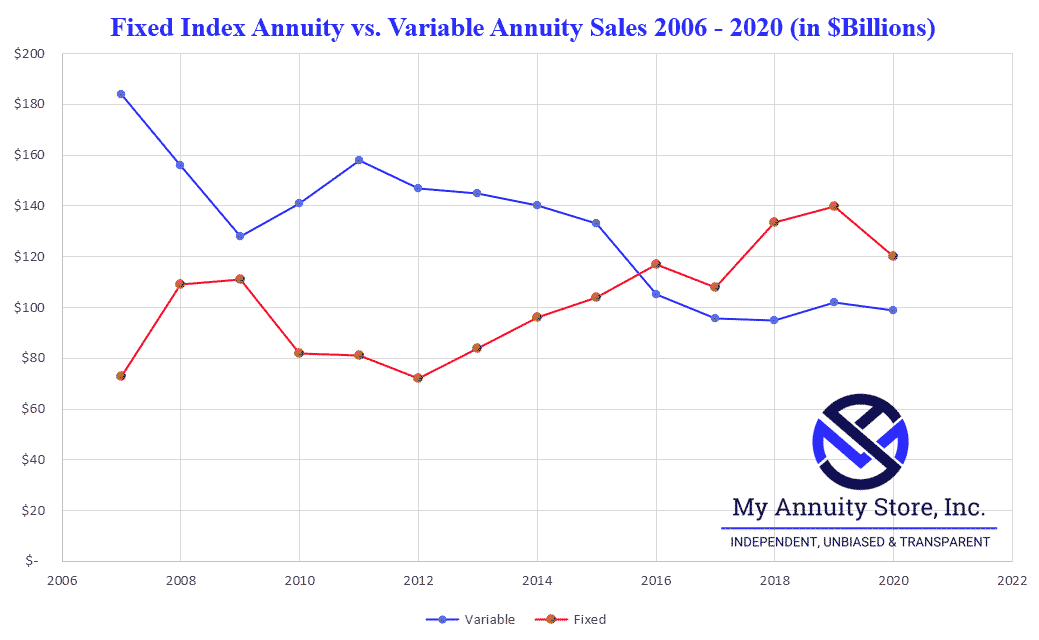
The line chart below compares the sales of variable annuities (VA) and fixed index annuities (FIA) in the United States from 2006 to 2020.
Variable annuities are represented by the blue line while the red line represents fixed indexed annuity sales.
As you can see, variable annuities have decreased in popularity significantly while fixed index annuities are becoming increasingly popular.
VA sales decreased from approximately $185 Billion in 2006 to ~$100 Billion in 2020 while FIA sales increased from ~$75 Billion to ~$120 Billion during the same timeframe.
This is due in large part to the high cost and fees associated with variable annuities.
Typical Variable Annuity Fees
- M&E (mortality and expense) – average around .50%
- Sub-Account Fees – average 1.00%
- Optional Rider Fees (income rider or death benefit rider) – Average 1.00% each
Fixed Index Annuity Fees
- No Sub-Account Fees
- No M&E Fees
- Death Benefit is Full Account Value – No Fee
- Optional Income Riders – Typically .95% to 1.25% annually
Best Uncapped Fixed Index Annuities
Allianz, AIG, and Athene have all been innovators in the indexed annuity space and I would attribute much of their success to that fact.
Specifically, they all have uncapped crediting strategies and offer proprietary volatility-managed indexes.
For more comprehensive information read our best stock market index options available in an index annuity guide which ranks the top indexes and crediting strategies based on historical hypothetical returns.
Best Indexes Available in an Index Annuity
Based on historical back-testing I’ve compiled a list of what I believe to be the best stock market indices available in a fixed index annuity with uncapped crediting options.


