AQR DynamiQ Allocation Index
AIG’s Power Protector Series of Index Annuities just got a shot in the arm as AIG announced they’ve added a new index to their product line.
The AQR DynamiQ Allocation Index SM (the “Index”) seeks to maximize returns by delivering diversified exposure to global equity and fixed income markets. The Index utilizes a style-based approach designed to systematically identify securities and other investment instruments expected to perform well in changing markets.
American General Life Insurance Company had the AQR DynamicQ Allocation Index developed exclusively for the Power Protector Series of Index Annuities by AQR, an innovative asset management firm recognized for its world-class research and efficient portfolio construction (see page 8 for more information on AQR).
These annuities are issued by American General Life Insurance Company, a member company of AIG.
“We are excited that AIG Life & Retirement will be the first to bring AQR’s sophisticated, style-based investment approach to consumers through an index annuity,” said Bryan Pinsky, Senior Vice President of Individual Retirement Pricing and Product Development at AIG.
Understanding a Fixed Index Annuity
A Fixed Index Annuity (FIA) is a contract issued by an insurance company and not a direct investment in the stock market. The FIA provides you with the opportunity to earn interest based in part on the performance of an external index, like the AQR DynamiQ Allocation Index. This is called an indexing strategy.
A declared rate strategy is also available and guarantees a set interest rate for a specific period of time.
Please see our Ultimate Guide to Fixed Index Annuities for more information on how an index annuity works. A complete list of available indexes, by the insurer, is available on our Fixed Index Annuity Marketplace page.
AQR DynamiQ Allocation Index
1. Multi-Style Building Blocks
Key to the AQR DynamiQ Asset Allocation Process
AQR has extensive knowledge and expertise in researching and analyzing the characteristics that drive an asset’s performance versus its peers. The company’s unique brand of style investing has emerged from this in-depth research.
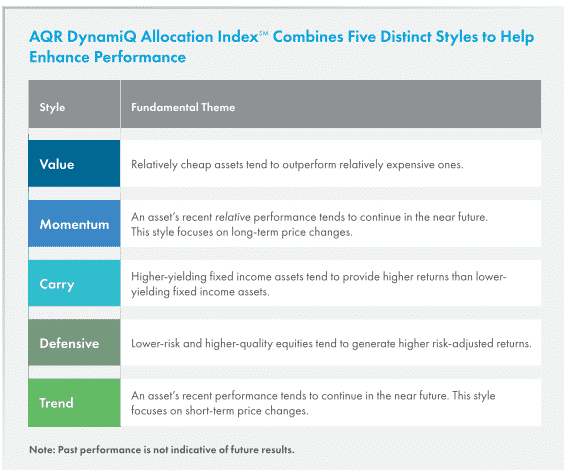
Styles offer a systematic and repeatable way to identify drivers of a return across a broad universe of asset classes and markets. The AQR DynamiQ Allocation Index is designed to provide exposure to the five following styles, which have each historically delivered persistent, long-term performance.
The Power of AQR’s DynamiQ Multi-Style Approach
Each of the five styles seeks to capture a distinct source of return and tends to perform well at different times for different reasons.
By utilizing a rules-based approach to combine styles thoughtfully and deliberately, the AQR DynamiQ Allocation Index offers the potential for greater returns and reduced risk across a variety of market environments.
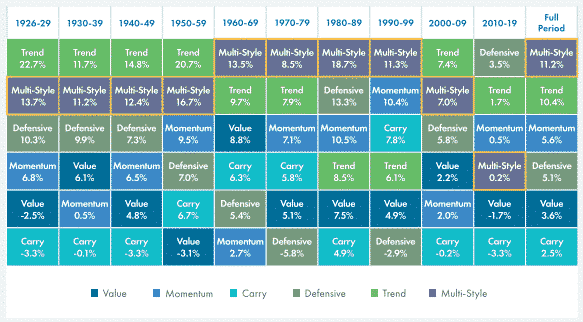
For example, take a look at the historical returns of the five styles in the Index, if they had existed since the 1920s.
As the hypothetical example below shows, the Multi-Style approach would have been at or near the top of the performance rankings in nearly every decade since the 1920s.
A Multi-Style Approach Has Historically Provided Higher, More Consistent Returns Over Time Hypothetical Average Annual Returns, 1926-2019
2. Global Diversification Across Equities and Fixed Income
A 3-Step Allocation Process Across Styles and Asset Classes
Global diversification may help you build wealth by expanding growth opportunities and spreading risk across many styles, asset classes, and geographical regions.
The AQR DynamiQ Allocation Index uses a systematic, rules-based process to diversify across a wide range of global equity and fixed income markets, adjusting exposures based on specific styles and risk targets. Here’s how the process works:
Step 1: Determine the strategic allocation
Starting with a base allocation of 40% equities and 60% fixed income, the Value, Momentum, Carry, and Defensive styles are used to determine the regional weights in each asset class every month.

Step 2: Tactically adjust the Index toward equities, fixed income or both
The Trend style is then analyzed monthly to help capitalize on short-term price changes. Depending on whether equity and fixed income prices are trending up, down, or in different directions, the Index will shift its allocation toward equities, fixed income, or both.
Step 3: Manage Risk Daily
Total exposure to equities and fixed income is scaled up or down daily to maintain target volatility of 5%.
3. Potential for Positive Returns With Lower Risk
Capitalize on the Power of Diversification
The AQR DynamiQ Allocation Index is designed to help capture multiple sources of returns from a wide range of assets rather than a small concentrated group.
This approach, diversified by style as well as geography, has the potential to produce positive returns with a smoother, less volatile ride over the long term.
As you can see from the hypothetical chart below, the AQR DynamiQ Allocation Index would have captured some of the growth of the S&P 500 Index (without dividends), if it had existed over the last 15 years, but with less volatility than the overall stock market.
Strong Risk Management During Market Downturns
The systematic risk-management process of the Index can help it deliver positive returns when the market is up and potentially limit losses during market downturns.
For example, consider how the Index would have performed during the worst-performing quarters for U.S. stocks if it had existed over the last 15 years.
While the S&P 500 Index (without dividends) posted double-digit losses, the Index would have experienced declines of less than 5%.
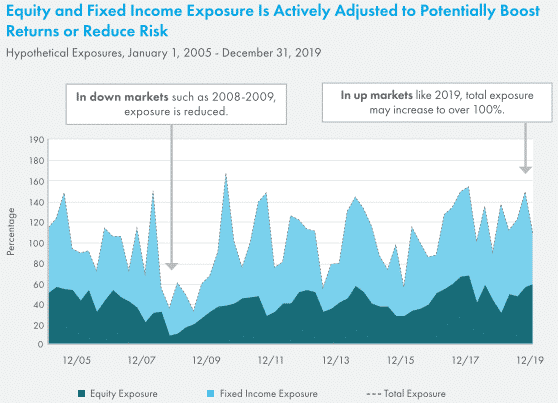
As you can see from the chart below, if the Index had existed during the recent bull market, it would have had near-maximum equity and fixed income weighting of 155% in 2019. In contrast, during the bear market of 2008-2009, only 35% of the Index would have been allocated to equities and fixed income, a move that could have limited losses in the Index.
AQR DynamiQ Allocation Index Minimizes Volatility
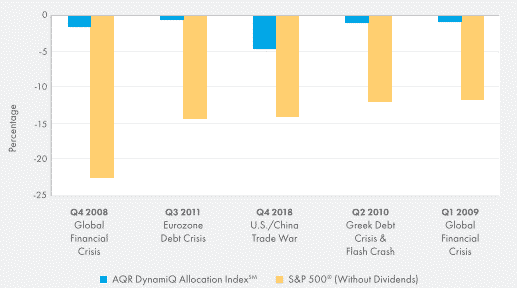
Hypothetical AQR DynamiQ Allocation Index Performance During the Worst-Performing Quarters for U.S. Stocks From January 1, 2005 Through December 31, 2019 [1]
Investment innovation at the nexus of economics, behavioral finance, and data and technology
As quantitative investors, AQR believes that a disciplined and systematic approach to investing is the best way to achieve long-term results. The ideas behind AQR—or Applied Quantitative Research—were founded in academia and have been in the firm’s DNA ever since. Since it was established in 1998, the company has:
• Published over 300 white papers, articles, books, and thought leadership pieces.
• Received more than 50 industry awards and accolades.
• Been among the most frequently cited research firms in top journals.
AQR DynamiQ Allocation Index
Can Help You Enhance Returns While Managing Risk
Please contact My Annuity Store for more information: 855-583-1104.
The AQR DynamiQ Allocation Index is designed and overseen by AQR’s experienced Multi-Strategy team that also leverages the expertise of the broader research effort at AQR
Source: AQR. All figures approximate as of 12/31/2019. Assets under management includes assets managed by AQR and its advisory affiliates. The number of professors includes current and former professors.
[1]Note: Past performance is not indicative of future results. Sources: AQR, Bloomberg. This hypothetical example is for illustrative purposes only. It is intended to show the performance of the AQR DynamiQ Allocation Index SM versus the S&P 500 ® Index (without dividends) during the worst-performing quarters for the stock market from 1/1/05–12/31/19 if the Index had existed during this time.
The Index was created on 5/18/20. Levels for the Index before 5/18/20 represent hypothetical data determined by the retroactive application of a back-tested model, itself designed with the benefit of hindsight.
Returns for the AQR DynamiQ Allocation Index SM are net of an annual fee. If dividends were included in the S&P 500 ® Index, the declines may have been less steep. The above chart does not reflect the amount of interest credited to an index annuity during this time period.
Actual results for a specific insurance contract would depend on the crediting strategy chosen and the index rate cap, spread, and/or participation rate for the time period(s) shown. Individuals cannot invest directly in an index or the market. See back cover for index definitions and more information.
A Word About Risk
Stocks and bonds are subject to risks, including the possible loss of principal. International stocks that provide exposure to foreign markets involve special risks, such as currency fluctuations, differing financial reporting, and regulatory standards, and economic and political instability.
These risks are highlighted when stocks are from emerging markets. Stocks of small-cap companies are generally more volatile and not as readily marketable as those of larger companies.
Government bonds and Treasury bills are subject to interest rate risk, but they are backed by the full faith and credit of the U.S. government if held to maturity. The repayment of principal and interest of a corporate bond is guaranteed by the issuing company, and subject to default and credit risks. Indices are unmanaged and not available for direct investment.
Please discuss with your financial professional or agent the benefits and risks of these securities.
Index Definition
The S&P 500 ® Index is a market-capitalization-weighted index of the 500 largest U.S. publicly traded companies. The index is widely regarded as the best gauge of large-cap U.S. equities. The S&P 500 ® is a price return index and does not include the impact of dividends.
Index Methodology
The AQR DynamiQ Allocation Index SM (the “Index”) is a long-only index providing exposure to futures on third-party equity indices primarily comprised of large-cap securities of U.S. and non-U.S. issuers from developed markets, and exposure to futures on U.S. and non-U.S. developed government fixed-income securities.
The Index will target an average of 40% equity and 60% fixed income weighting over the long-term.
The exposures of the Index to equity and fixed income will vary based on a rules-based methodology that allocates to equity and fixed income based on several well- known investment styles, with the potential for substantially different weightings from the 40/60 target depending on both market conditions and the attractiveness of each asset according to signals within the Index methodology
.
Back-Test Information on Multi-Style Approach Chart
AQR back-tests of Value, Momentum, Carry, Defensive, Trend, and Multi-Style theoretical long/short style components are based on monthly returns, undiscounted, gross of fees and transaction costs, excess of a cash rate proxied by the Merrill Lynch 3-Month T-Bill Index, and scaled to 12% annualized volatility.
Each strategy is designed to take long positions in the assets with the strongest style attributes and short positions in the assets with the weakest style attributes while seeking to ensure the portfolio is market-neutral. The Style and Asset Group Composites, are based on an allocation to the style components and asset group components based on their liquidity and breadth.
The components are then allocated with roughly equal weighting to each of the styles within an asset group (as not all four styles are present in each asset group).
Stock and Industry Selection: approximately 2,000 stocks across Europe, Japan, and U.S. Country Equity Indices: Australia, Canada, Eurozone, Hong Kong, Japan, Sweden, Switzerland, U.K., and the U.S. Within Europe: Italy, France, Germany, Netherlands, and Spain.
Bond Futures: Australia, Canada, Germany, Japan, U.K., and U.S. Currencies: Australia, Canada, Euro, Japan, New Zealand, Norway, Sweden, Switzerland, U.K., and the U.S.
Index annuities are not a direct investment in the stock market. They are long-term insurance products with guarantees backed by the claims-paying ability of the issuing insurance company.
They provide the potential for interest to be credited based in part on the performance of the specified index, without the risk of loss of premium due to market downturns or fluctuations. Index annuities may not be appropriate for all individuals.
Withdrawals may be subject to federal and/or state income taxes. An additional 10% federal tax may apply if you make withdrawals or surrender your annuity before age 59½. Consult your tax advisor regarding your specific situation.
Interest earned in an index annuity is calculated using index performance over a specific term, subject to contract provisions, such as an index rate cap, spread, or participation rate, which may limit or reduce the upside potential.
The index rate cap is the maximum percentage of index performance that can be credited as interest for an index term. The spread is the minimum threshold or percentage that index performance must exceed to be credited interest. The participation rate is the percentage of index performance that is used to calculate interest in certain
My Annuity Store, Inc. provides a platform for individuals to acquire knowledge, request, compare, price, and select income, fixed, and fixed index annuities. My Annuity Store’s sole purpose is to elevate and simplifying the experience of acquiring annuity education and product solutions.
We provide the broadest, most unbiased, and independent, multi-carrier platform available to Americans to easily request, compare, price, and purchase annuities at any age in their lifecycle. Our website is versatile, easy to use and is equipped with educational tools aimed to help our visitors better understand the role annuities can play in a retirement portfolio.
A lack of educational materials and access to structured products and annuities has hindered the widespread adoption of these strategies in the United States.
My Annuity Store strives to educate and provide individuals with the materials and tools to better understand these products, so they feel comfortable utilizing them to increase the likelihood of reaching their overall investment goals.
Our solutions are designed to minimize risk, not increase it. Our nation is in an unprecedented situation with a population that grows older each day. As uncertainty persists and volatility creeps back up into the market, annuities products will likely continue to increase in popularity. My Annuity Store’s mission is to empower retirees to make informed financial decisions regarding their retirement accounts.

