MLSB Index Performance (Back-Tested & Actual)
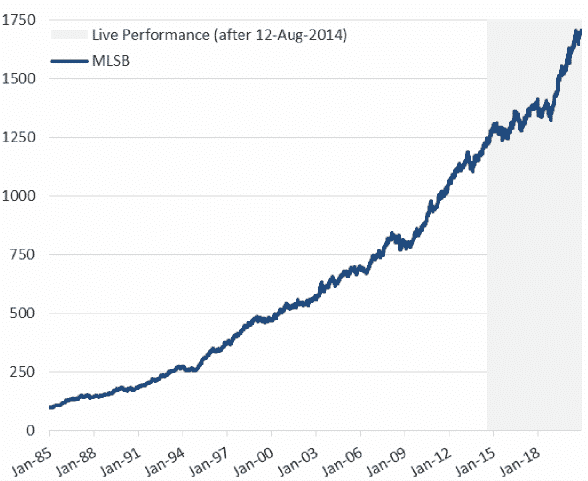
January 13, 1985, to December 31, 2020. Source BofA Securities, Bloomberg: The Index was created on August 12, 2014. Levels for the Index before August 12, 2014, represent hypothetical data determined by the retroactive application of a back-tested model, itself designed with the benefit of hindsight. Past performance is not indicative of future performance. Actual performance will vary, perhaps materially, from the performance set forth herein. The performance of the Index includes a 50bps fee drag and does not include fees or costs of any financial instrument referencing the index.
Merrill Lynch Strategic Balanced Index (MLSB Index) Overview
| MLSB Index General Information | |
|---|---|
| ASSET CLASS | Multi-Asset |
| BLOOMBERG TICKER | MLSB Index |
| CURRENCY USD VOLATILITY TARGET | 6% |
| REBALANCING | Semiannually |
| INDEX FEE | 0.50% |
| BASE DATE | 31-Jan-85 |
| LIVE DATE | Aug-12-2014 |
| INDEX SPONSOR | Merrill Lynch International |
| INDEX CALCULATION AGENT | S&P |
The MLSB index is available exclusively inside AIG’s Power Protector Series of fixed index annuities. In this article, we’ll first explain the features of the MLSB itself, and then we’ll show you how it works inside of the AIG Power 7 Protector fixed index annuity.
The ML Strategic Balanced Index uses a rules-based approach to blend equity and fixed income indices. By dynamically blending exposure between equity, fixed income, and cash the ML Strategic Balanced Index seeks to provide a stable return during all types of markets.
As mentioned, the MLSB Index is available exclusively with select index annuity products issued by American General Insurance (AIG). It contains an equity asset (SPX Index) and a fixed income asset (MLT1US10). The relative weights of the two assets within the portfolio are determined semiannually, based on a methodology that is designed to generate equal risk contribution from each asset class.
About Hypothetical Depictions
Showing the index comparison doesn’t necessarily indicate how much interest would have been credited to a fixed index annuity over that time period. Actual contract results would depend on the crediting method chosen, and caps and spreads in place during that time period. Past results are not a guarantee of future results.
The back-tested performance is based on the methodology and mechanics of the index retroactively applied to historical market data, as if the index had previously existed, to generate hypothetical performance during the periods of time depicted.
This back-tested performance for any constituent that makes up the index may have actual performance and history, and it will also have back-tested data for any period before its inception.
Back-tested performance may not be a reliable indicator of future results. Prospective application of the methodology and mechanics of the index may not result in performance commensurate with the back-tested returns shown.
How the MLSB Index Works in an AIG Annuity
The ML Strategic Balanced Index is available inside of the AIG Power Protector Series of Fixed Index Annuities. The available crediting method is an annual point-to-point with a participation rate.
At the time this was written on January 20, 2021, the participation rate was 85%($100K+) and 62% (<$100K) on the AIG Power 10 Protector Index Annuity.
What that means is if you selected this indexing option in the AIG Power 10 Protector Annuity the MLSB’s performance would be calculated annually on your contract anniversary. You would be credited interest equal to 85% or 62% respectively, of the indexes total performance.
- Example: Assuming $100K deposit into Power 10 Protector Index annuity 100% MLSB Allocation during a year in which the MLSB Index was up 10%.
10% Annual Performance = Annuity credited 8.5% (10% performance X 85% participation rate)
MLSB Index Performance in AIG Power 7 Protector
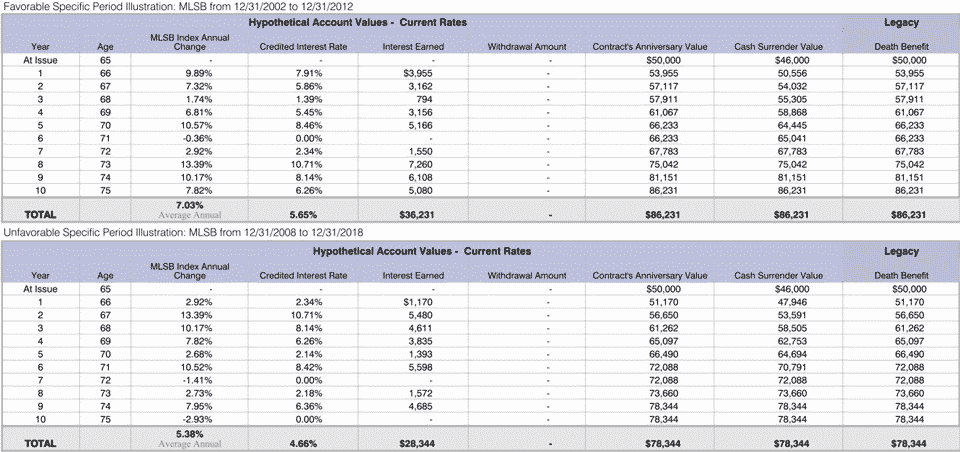
Below is a hypothetical illustration showing the interest credited to the Power 7 Protector using the Merrill Lynch Strategic Balanced Index. There are two separate tables – one for a favorable period (12/31/2002 to 12/31/2012) and one for an un-favorable period (12/31/2008 to 12/31/2018).
- Favorable period: 5.65% average annual return
- Un-favorable period: 4.66% average annual return
January 13, 1985 to December 31, 2020
More Stock Market Indexes in Annuities
3 Key Features of the Merrill Lynch Strategic Balanced Index
1. Rules Based Indexing
Systematic Non-Discretionary Approach
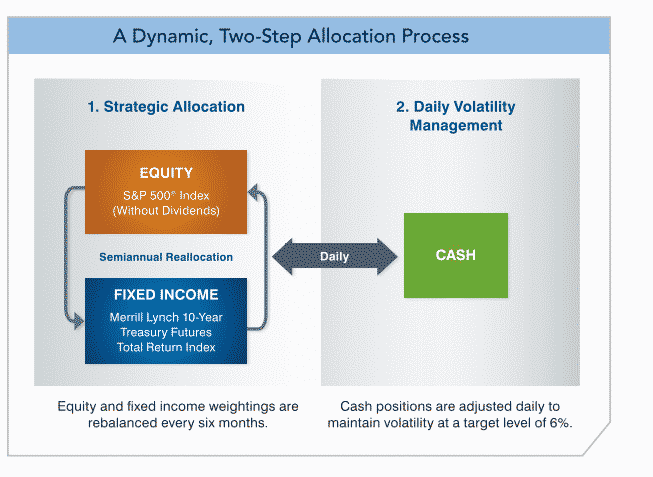
The ML Strategic Balanced Index employs quantitative rules based on market volatility to adjust exposures between the S&P 500 Index (without dividends) and the Merrill Lynch 10-Year Treasury Futures Total Return Index. This rules-based process eliminates the impact that emotions may have on allocation decisions, making the process objective and transparent.
Equity and fixed income allocations are rebalanced semiannually based on the historical volatility of the underlying indices. Volatility is also monitored on a daily basis. Allocations may be shifted to cash when short-term volatility rises above 6% and from cash when volatility falls. The Index seeks to maintain volatility at this level to help balance risk and return.
Benefits of Rules-Based Approach
- A consistent approach to pursuing objectives
- Unbiased when determining how to adjust the weighting of the underlying indices
- Transparent in how the allocation works
2. Risk Control
Strategic Allocation Approach
To help manage volatility risk, weightings between the S&P 500 Index (without dividends) and the Merrill Lynch 10-Year Treasury Futures Total Return Index are adjusted using a three-step, rules-based process: 
- Analyze the recent historical volatility of the underlying indices.
- Determine the index weightings based on this volatility data. Generally, the greater the volatility of an underlying index, the lower the exposure to that index.
- Review the weightings of the underlying indices after six months and reallocate, if necessary.
3. Daily Volatility Management
Blending Equity and Fixed Income Indexes
As an additional measure of risk control, the Index’s combined equity and fixed income weighting may be shifted to and from cash on a daily basis. Usually, cash positions are increased when volatility rises above the 6% threshold for the Index and decreased when volatility declines. During highly volatile markets, up to 100% of the underlying indices may be allocated to cash to help protect against market downturns.

MLSB Index Resources
This MLSB Index Microsite tracks the Merrill Lynch Strategic Balanced Index Performance Daily and allows you to view YTD returns among many others.
- MLSB Index Microsite – track the Merrill Lynch Strategic Balanced Index’s Daily Performance
- Merrill Lynch Strategic Balanced Index Fact Sheet
- AIG Annuity Rates Effective June 7 2021
- Merrill Lynch Strategic Balanced Index (MLSB) Brochure
- AIG Profile and Ratings


