Lincoln OptiBlend 5 Review.
This Lincoln OptiBlend 5 Review will cover:
- Product Type
- Fees (if any)
- Currently available stock market indexes and crediting rates
- Realistic rate of return expectations
- Pros & Cons
Lincoln Financial Ratings
When shopping for an annuity it is very important to consider the financial strength of the issuing insurance company. This is because the guarantees of an annuity are backed by the claims paying ability of the insurance company who issued it.
When it comes to financial strength and stability, it doesn’t get much better than Lincoln Financial Group. LFG was founded in 1905 and as of March 31st, 2020, they were #188 on the Fortune 500 list based on revenue. They are rated A+ with AM Best. A+ by Fitch and AA- by Standard & Poor’s.
| Lincoln Financial Group | Rating |
|---|---|
| 1300 South Clinton St., Fort Wayne, IN 46802 | |
| A.M. Best Rating (15 possible ratings) | A+ (2) |
| Moody's (21 possible ratings) | A1 (5) |
| Fitch (21 possible ratings) | A+ (5) |
| Standard & Poor's (Financial Strength, 20 Ratings) | AA- (4) |
| Comdex (percentile of all rating companies) | 90 |
Lincoln OptiBlend 5 is Best for Accumulation
Annuity Sales in the United States have continued to rise the past few years. However, they still get a lot of criticism in the media and even by some financial advisors as for being complicated. In reality, annuities are much less complicated than most other investment products with both pros and cons.
However, there are many different types of annuities, each of which is designed to achieve a certain goal. Once you’ve learned which types of annuities are best suited for a particular goal their much easier to understand. We’ll try to our best to make the Lincoln OptiBlend 5 as easy to understand as possible today.
Lincoln OptiBlend 5 Annuity Reviewed
Fixed index annuities are a type of fixed annuity. Being a fixed annuity means that it can not lose money due to market performance. Fixed Index annuities differ from fixed annuities in the way they credit interest.
Rather than guarantee an interest rate for a set period of years like a fixed annuity, a fixed index annuity guarantees a floor of zero percent. Each year it has the potential to earn index based on the performance of an external market index.
Product Highlights
- Surrender Charge Schedule: 5 Years
- Surrender Schedule: 9%, 8%, 7%, 6%, 5%, 0%
- Annual Free Withdrawal Amount: 10% withdrawals of the contract value are permitted each contract year with out incurring a surrender penalty.
- Minimum Premium: $10,000
- Maximum Premium: $2,000,000
- Nursing home and terminal illness benefits: Allows access to contract value without surrender charge or MVA if certain conditions are met. Please see the Disclosure Statement for necessary criteria and conditions.
- Issue Ages: 0-85 Years
Interest Crediting Strategies
• Fixed Account
• 1 Year Fidelity AIM Dividend Participation
• 1 Year S&P 500 5% Daily Risk Control Spread
• 1 Year S&P 500 Cap
• 1 Year S&P 500 Participation
See current rates at our online index annuity store
Interest Crediting Components
- Cap – is the maximum interest the annuity can earn in a crediting period.
- Spread – is the amount subtracted from an index’s gain during the crediting period.
- Participation Rate – determines what percent of the index’s gain will be used to calculate your indexed interest.
| Index Performance | PAR Rate | Interest Earned |
|---|---|---|
| 10% | 80% | 8% |
| 5% | 80% | 4% |
| -5% | 80% | 0% |
| Index Performance | Cap | Interest Earned |
|---|---|---|
| 8% | 5% | 5% |
| 5% | 5% | 5% |
| -3% | 5% | 0% |
Proprietary Fidelity AIM Dividend Index
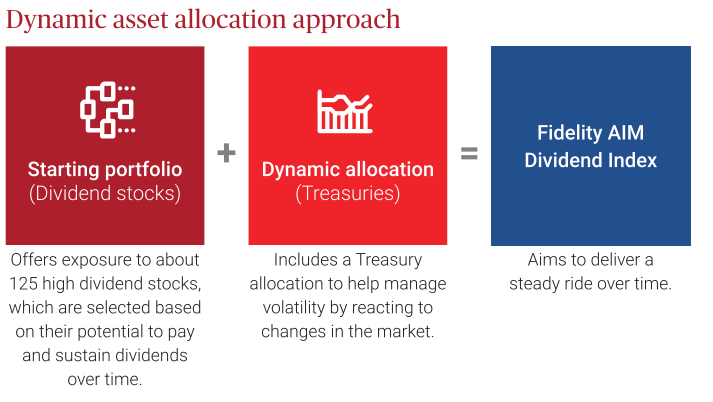
We believe that the Fidelity Dividend AIM index is the best available indexing option inside of the Lincoln OptiBlend 5. If you’re looking to benefit from market upside potential with less exposure to market volatility, the Fidelity AIM Dividend Index may be a great option.
Available with your fixed indexed annuity, the 1 Year Fidelity AIM Dividend Participation account is tied to the Fidelity AIM Dividend Index.
It’s managed by Fidelity, an asset manager with over 70 years of experience and one of the largest research teams in the industry. The Fidelity AIM Dividend Index uses a set of rules that utilizes a dynamic asset allocation approach.
It blends the appeal of high dividend stocks with the safety of U.S. Treasuries to help manage changes in the market and deliver a steady investment experience over time.

Lincoln OptiBlend 5 Reasonable Rate of Return Expectations
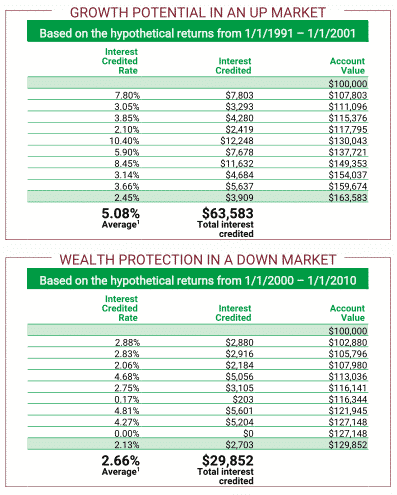
Below is a chart showing hypothetical returns of the Lincoln OptiBlend 5 during two separate 10 year periods. A time of market growth (1991 – 1/1/2001) and a 10 year period during a down market (1/1/2000 – 1/1/2010).
These are only hypothetical returns and not a guarantee or prediction of future returns. For this illustration we allocated $50,000 into the Fidelity Dividend AIM index with a 55 % participation rate. The remaining $50,000 was allocated to the S&P 500 Daily Risk Control 5% Index with an annual spread of 3.75%.
Based on the hypothetical illustration the Lincoln OptiBlend 5 would have credited an average rate of return of 5.08% from 1991 to 2001; which was an up market. During the generally down market between 2000 and 2010 the contract would have credited an average of 2.66% return.
Lincoln OptiBlend 5 Historical Performance

Watch Lincoln Financial Retirement Income Video
Lincoln OptiBlend Pros and Cons
We give the Lincoln OptiBlend 5 Fixed Index Annuity a 4 out of 5 stars.
PROS
- Short 5 year duration
- 10% Free Withdrawals Annually
- Nursing Home and Terminal Illness Rider
- Four Unique index crediting strategies in addition to a declared rate strategy
- Issued by one of the strongest insurance companies in the U.S.
CONS
- Other 5 Year Index Annuities with better historical rates of return.
Resources:
Lincoln Financial Group has a website specifically designed to provide individual consumers annuity educational resources. Explore Annuities and Insurance from Lincoln Financial Group.
Back to Annuity Reviews


