JourneyGuide Retirement Planning Calculator | My Annuity Store

Plan Your Retirement with Confidence

Get a personalized retirement income strategy in minutes with our free JourneyGuide Calculator

Start Your Free Plan
100% Free
No Obligation
Independent & Unbiased
Instant Results

Why Use JourneyGuide?

Take control of your retirement planning with our comprehensive, easy-to-use calculator

📊

Personalized Analysis

Get a customized retirement income plan based on your unique financial situation and goals

💰

Income Projections

See exactly how much guaranteed income you can generate throughout retirement

🎯

Gap Analysis

Identify any shortfalls between your retirement income and expenses before it's too late

📈

Multiple Scenarios

Compare different strategies to find the best approach for your retirement

🛡️

Risk Protection

Understand how to protect your retirement from market volatility and longevity risk

📄

Detailed Reports

Receive comprehensive reports you can save, share, and review with advisors

See JourneyGuide in Action

Watch this quick 2-minute overview to see how easy it is to create your retirement plan

Start Your Free Retirement Plan

Answer a few simple questions and get your personalized retirement income strategy

Your Comprehensive Retirement Report

Here's what you'll receive after completing the JourneyGuide Calculator

📊

Income Timeline

Visual breakdown of your retirement income sources year by year, including Social Security, pensions, and annuities

💵

Cash Flow Analysis

Detailed monthly and annual cash flow projections showing income vs. expenses throughout retirement

🎯

Gap Analysis Report

Identify any income shortfalls and receive specific recommendations to close the gap

📈

Strategy Comparison

Side-by-side comparison of different annuity strategies and their impact on your retirement

🛡️

Risk Assessment

Understand your exposure to market risk, inflation, and longevity risk with actionable insights

Action Plan

Step-by-step recommendations tailored to your situation to optimize your retirement income

Frequently Asked Questions

Everything you need to know about the JourneyGuide Calculator

Is the JourneyGuide Calculator really free? +
Yes! The JourneyGuide Calculator is 100% free with no hidden fees or obligations. We believe every American deserves access to quality retirement planning tools. You'll receive your complete personalized report at no cost.
How long does it take to complete? +
Most people complete the calculator in 5-10 minutes. You'll answer questions about your age, retirement goals, current savings, expected Social Security, and desired retirement lifestyle. The more accurate your information, the better your personalized recommendations will be.
Do I need to talk to someone to get my results? +
No. You'll receive your detailed retirement report immediately after completing the calculator. However, if you'd like to discuss your results with one of our licensed retirement specialists, we're happy to schedule a complimentary consultation at your convenience.
Is my information secure? +
Absolutely. We use bank-level encryption to protect your data. Your personal information is never sold or shared with third parties. We take your privacy seriously and comply with all data protection regulations.
What makes JourneyGuide different from other retirement calculators? +
JourneyGuide goes beyond basic retirement calculators by providing comprehensive income planning strategies, including annuity options from multiple carriers. As an independent platform, we compare solutions from over 30 top-rated insurance companies to find the best fit for your unique situation—not just what one company offers.
Can I use this if I'm already retired? +
Yes! JourneyGuide works for both pre-retirees and those already in retirement. If you're already retired, the calculator will help you optimize your current income strategy and identify opportunities to increase guaranteed income or reduce risk.
Will I be pressured to buy an annuity? +
Never. Our mission is education first. The JourneyGuide Calculator provides unbiased information to help you make informed decisions. Whether an annuity is right for you depends on your unique situation. We're here to provide transparent information, not pressure you into any purchase.
What if I don't understand my results? +
We're here to help! Your report includes clear explanations and definitions. If you have questions, you can schedule a free consultation with one of our licensed retirement specialists who can walk you through your results and answer any questions. Call us at 855-583-1104 or email info@myannuitystore.com.
Impact of Guaranteed Income Streams
 

Protect Against Longevity Risk

The impact of when one takes Social Security is demonstrated instantly with JourneyGuide. Other guaranteed income streams like pension and annuity benefits are simple to include. Current annuity pricing is integrated directly into the tool, unlike any other software. JourneyGuide illustrates the findings of our research with leading universities – there is a balanced approach to blending investments with guaranteed income to improve retirement outcomes.

Move Clients from Uncertainty to Confidence
 

Manage Sequence of Return Risk

Show your clients the changes they can make to go from uncertainty to success in retirement. Our Income Frontier graph keeps you the advisor focused on ensuring your strategy is in the best interests of your clients. We give you and your clients confidence that they will have what they need regardless of the market outcome.

Understand The Pitfalls
 

Create a Plan for the “What ifs”

The most careful plans for retirement can fall apart due to a multitude of risks. Use JourneyGuide to stress test your proposed plan from the following:

  • Long Term Care
  • Early Death
  • Early Employment
  • Stock Market Losses
Know Your Best Strategy
 

Optimize Social Security

Calculate your client’s Social Security benefits at each possible age using their Primary Insurance Amount or prior year wages, and if eligible, determine the best route for claiming spousal benefits.

Assumptions and Approaches

Default Asset Class Returns:

JourneyGuide retirement planning calculator employs asset class return and volatility assumptions based on a blend of 35 investment firms’ 10-year asset projections as compiled by Horizon Actuarial Services, LLC.

An aggregated set of asset class arithmetic means returns, standard deviations, and a correlation matrix is created from these sources and updated annually. The chart below represents the current default asset class assumptions.

Journeyguide retirement planning calculator asset class assumptions

Taxes:

The impact taxes can have on the available funds for consumption in retirement can be dramatic and must be addressed.

JourneyGuide calculates an after-tax income by calculating a combined average effective tax rate (CAETR) and taking into consideration the conditions impacting a client’s 1040 form, such as short- and long-term capital gains, taxable yield, and dividends, and the client’s applicable income brackets.

The client’s income from sources such as Social Security, pensions, annuities’ exclusion ratio, and withdrawals from qualified and non-qualified assets are also considered. Each state’s handling of items such as taxing Social Security, qualified income, and AGI deductions and exemptions are included along with that state’s income brackets if applicable.

All clients’ scenarios have been automatically updated to reflect the 2021 federal income tax brackets and exemptions.

Inflation:

The default inflation rate assumes growth of 2 percent, increasing by 3 basis points annually.

Spending Taper:

A limitation found in a surprising number of research and software programs is the assumption that spending is a consistent, inflation adjust number. In reality, clients’ spending habits change as they experience different stages in their life cycles.

Research highlights how clients begin to decrease their spending once they pass their retirement golden years, and increase when their health starts to deteriorate with age. To account for these lifecycle adjustments, we include a default spending taper between ages 75 and 85 of 1.5 percent, increasing by 20 basis points annually.

The taper is netted with inflation and has three stages where the inflation pressure is lessened, then neutralized, and finally then reversed. The net impact, is an overall decrease in spending ranging from 3 – 6% depending on the client’s starting age, retirement length, assets amount, and other key inputs.

You can elect to include or exclude the spending taper, allowing income to grow with your inflation assumption.

Default Model Portfolios:

JourneyGuide provides several default model portfolios for the purpose of initiating a discussion between an advisor and the client about asset allocation. JourneyGuide makes no attempt to recommend which allocation is appropriate for a given client’s risk level. Below are the default allocations.

Journeyguide retirement calculator default model portfolios table


Social Security Retirement Income Benefit Projections:

Social Security rules are complex. In fact, for those who are or will be eligible but are not currently receiving retirement income benefits, the Social Security Administration (“SSA”) has four different calculators which project future retirement income benefits all with varying degrees of accuracy.

Only the SSA can tell clients precisely the benefits to which they will be eligible or are eligible and the amounts they will receive.

Where clients are currently receiving Social Security retirement income benefits, JourneyGuide uses those actual amounts in all retirement income forecasts.

Where clients have yet to file for Social Security retirement income benefits, JourneyGuide uses a methodology to project future retirement income benefit amounts similar to the Social Security Administration’s online calculator, Quick Calculator.

These projections are not to be considered advice but are estimates of individual retirement income benefit amounts and, where applicable, include projections of excess spousal retirement income benefits and spousal survivor income benefits as well. The projections are based on earnings history and marital status.

Because Social Security benefits are based on a client’s history of covered earnings, our software uses either the client’s actual earnings history or estimates of past earnings based on the client’s earnings entered for the current year.

Where estimates of past earnings are used, the calculations take into consideration the national average wage indexing series used by SSA and advisor-selected general inflation factors to calculate past earnings. The Social Security Trustees’ annually published assumptions about future real wage growth are used.

All the information provided is based on current Social Security rules, benefits calculations, and payout promises of existing Social Security policy.

Our software is undergoing continual updating and revision to ensure that JourneyGuide incorporates relevant changes made to Social Security retirement income benefits. The software is fully updated to reflect the Bipartisan Budget Act of 2015.

Definition of Terms

Annual Spending Goal (After-Tax, Inflation-Adjusted)
Desired spending amount (after-tax, inflation-adjusted) during the first year of retirement.

Success Rate:
The likelihood that this plan may sustain the given spending level throughout retirement is based on the Monte Carlo simulations using the JourneyGuide assumptions and information provided by the client.

Retirement Plan End Age
The ending age of the plan’s evaluation; most commonly, it’s the expected age of death for the last surviving retiree.

Total Assets
The combined dollar amount for all taxable and non-taxable accounts is provided for this report.

Annual Savings
Total annual retirement savings amount per account type. If currently working, both employer and employee contributions should be included.

Select Asset Mix
The combined asset allocation across all accounts during retirement.

Advisory / Product Fee
Estimated combined fee, including both embedded product fees as well as brokerage / AUM advisory fees

Full Retirement Age (FRA)
Age at which a person may first become entitled to full or unreduced Social Security retirement benefits.

Benefit at FRA
Primary Insurance Amount (PIA) from the client’s Social Security statement.

Income Annuity
The type of annuity (Single Premium Income Annuity, Deferred Income Annuity, or Qualified Annuity Longevity Contract) is displayed along with whether the payout is for the life of only one person (name of applicable client) or both (joint). In the case of deferred annuities, the age at which income starts is also listed.

Arithmetic Mean
The arithmetic average of the sequence of returns is represented by the selected success rate.

Standard Deviation
The standard deviation of the sequence of returns is represented by the selected success rate.

Internal Rate of Return (IRR)
Represents the combined internal rate of return for the investment portfolio, including all cash flows, such that the ending portfolio value at the client’s retirement end age is zero.

Retirement Planning Calculator Important Disclosure Information
JourneyGuide is designed to be an interactive retirement planning experience for advisors and clients (individually or collectively referred to as “User” or “Users” as the situation permits). JourneyGuide’s mission is to provide software that helps advisors move clients from being concerned about their retirement to being confident in it.

The materials or other information generated as part of JourneyGuide concerning the likelihood of retirement income outcomes are meant for general illustration and/or information purposes only, are hypothetical in nature, do not reflect actual investment results, and are not guarantees of future results. 

Calculation methodologies utilized by JourneyGuide retirement planning calculators may differ from those used by other entities. The information presented is not intended for distribution to, or use by, any person in any jurisdiction where such distribution or use would be contrary to local law or regulation.

Any retirement outcomes produced by JourneyGuide may or may not reflect any specific product, and do not include any fees or expenses that may be incurred by investing in specific products. The actual returns of a specific product may be more or less than the returns used in JourneyGuide. Financial forecasts, rates of return, risk, inflation, and other assumptions may be used as the basis for illustrations. 

Such factors make calculations uncertain, so they should not be considered a guarantee of future performance or a guarantee of achieving overall financial objectives. Past performance is not a guarantee or a predictor of future results of either the indices or any particular investment.

JourneyGuide results may vary with each use and over time.

Information Provided by Users
Information that is provided about assets, financial goals, personal situations, and fees charged by advisors are key assumptions for the calculations and projections made by JourneyGuide. Please review any report generated by JourneyGuide to verify the accuracy of these assumptions. If any of the assumptions are incorrect, a User should notify his or her financial advisor. 

Even small changes in assumptions can have a substantial impact on the results shown. Information inputted into the JourneyGuide software should be reviewed periodically and updated when either the information or circumstances change.

JourneyGuide is not responsible for the accuracy or completeness of the information inputted into the software. All asset and net worth information is provided by Users and is not a substitute for the information contained in the official account statements held by Users’ custodians. The current asset data and values contained in those account statements should be used to update the asset information, as necessary.

Information Provided by Third Parties
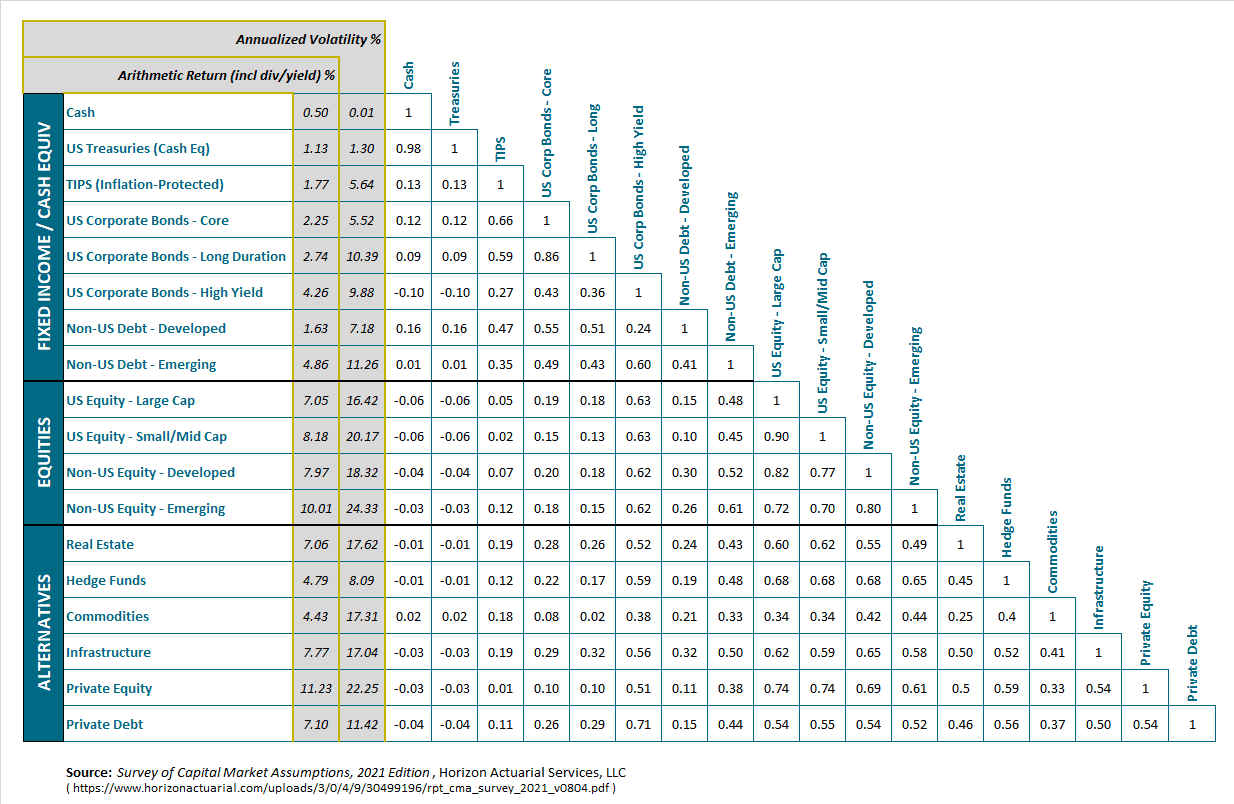
Projections. The projected return assumptions used in the software are estimates based on forecasts of each asset class, as provided publicly by Horizon Actuarial Services, LLC.

Product Information. All product information is from Cannex Financial Exchanges Limited (“Cannex”). Cannex collects information from insurance companies concerning their products for which companies like JourneyGuide may obtain and use. A User may have a choice to select a specific product or a “blend” of products representing the current marketplace for a type of product (referred to herein as “blended product”) as part of the JourneyGuide analysis. 

A blended product is a blend of several products in the marketplace which is on the Cannex system. It is not an actual product and cannot be purchased in the marketplace. A specific product is an actual product in the marketplace which is on the Cannex system. JourneyGuide is the sole entity that determines what products are available for use through the Cannex system and what products are included as part of the blended product. All methodologies for blending are determined by JourneyGuide.

Although JourneyGuide believes the data gathered from these third-party sources is reliable, it does not review such information and cannot warrant it to be accurate, complete, or timely. JourneyGuide is not responsible for any damages or losses arising from any use of third-party information.

Assumptions and Limitations
All results generated by JourneyGuide are hypothetical in nature, do not reflect actual investment results, and are not guarantees of future results. All results use simplifying assumptions that do not completely or accurately reflect a User’s specific circumstances. No software can accurately predict the future. 

Keep in mind that the strategies are at a point in time and may change due to updates or because of changes in personal circumstances or market conditions. As investment returns, inflation, taxes, and other economic conditions vary from the JourneyGuide assumptions, actual results will vary (perhaps significantly).

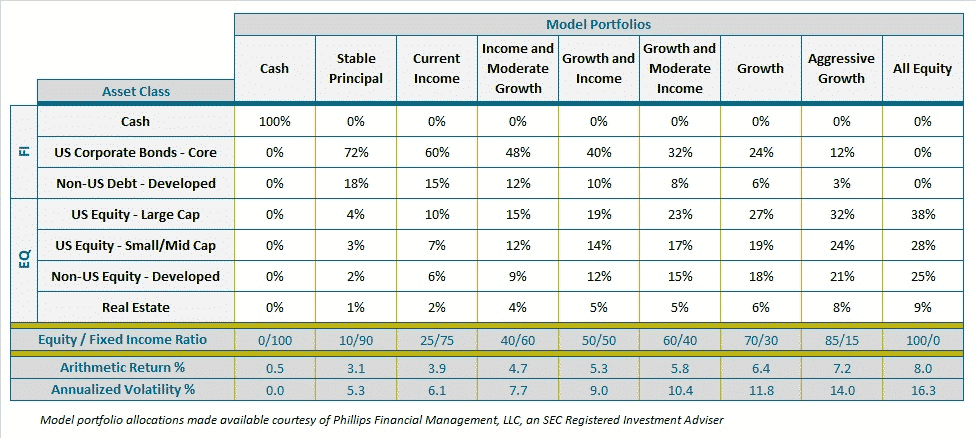
All JourneyGuide calculations use asset class returns, not returns of actual investments. The projected return assumptions used are estimates based on forecasts of each asset class. The portfolio returns are calculated by weighting individual return assumptions for each asset class according to a User’s portfolio allocation. 

The portfolio returns may have been modified by including adjustments to the total return and the inflation rate. The portfolio returns assume reinvestment of interest and dividends at net asset value. Interest and dividends are taxed for non-qualified accounts, but not taxed for qualified accounts. 

Portfolios are reallocated annually to the allocation as provided by a User for the applicable year. No costs, except for your advisor’s fee, portfolio rebalancing costs, and taxes, if applicable, are deducted from the portfolio value. No portfolio allocation eliminates risk or guarantees investment results.

JourneyGuide does not provide recommendations for any products or securities.

Results Using Monte Carlo Simulation
Monte Carlo simulations are used to show how variations in rates of return each year can affect results. Once all of the inputs and assumptions have been entered, the information is run through proprietary calculations to produce output. Five thousand Monte Carlo simulations are run in order to reflect the breadth of potential market returns that an individual could experience during retirement – fully taking into account the sequence of return risk. 

A Monte Carlo simulation takes information inputted by a User and certain return assumptions, each time using a different sequence of returns. Some sequences of returns will give better results, and some will give worse results. These multiple trials provide a range of possible results, some successful (meeting all goals) and some unsuccessful (not meeting all goals). 

The percentage of trials that were successful is the probability that a personal situation, with all its underlying assumptions, could be successful. In analyzing this information, please note that the analysis does not match actual market conditions, which may severely affect the outcome of goals over the long term.

Risks Inherent in Investing
Investing inherently has risks that could lead to the loss of value of assets. Generally, among asset classes, stocks are more volatile than bonds or short-term instruments and can decline significantly in response to adverse issuer, political, regulatory, market, or economic developments. The bond market is also volatile. 

Lower-quality debt securities generally offer higher yields compared to investment-grade securities, but they also involve a greater risk of default or price changes. International markets can be more volatile than U.S. markets due to increased risks of adverse issuer, political, market, or economic developments, all of which are magnified in emerging markets.

There is no guarantee that a diversified portfolio will outperform a non-diversified portfolio, and vice-versa, in any given market environment. No investment strategy, such as asset allocation, can guarantee a profit or protect against loss in periods of declining values. Inherent limitations and market conditions may affect the performance of the portfolios. Past performance does not guarantee results.

Income Strategies
Income strategies as used in JourneyGuide generally come in the form of social security benefits, pensions, and annuities as a de-accumulation vehicle. When it comes to annuities, are long-term investments designed to help meet retirement needs. JourneyGuide includes three types of annuities: fixed, fixed index, and variable.

A fixed annuity generally offers clients the ability to earn a fixed rate of return while an insurance company guarantees the principal. There are two types of income annuities: single premium immediate annuities (SPIA) and deferred income annuities (DIA). Generally, SPIA annuity payments must begin within one year of purchase, while DIA annuity payments can begin after a specific waiting period up to a specific age limit.

A fixed indexed annuity generally offers clients index-linked strategies providing for downside protection combined with upside potential linked to the price of an index, such as the S&P 500.

A variable annuity generally offers allocation options among different asset classes, like equity and debt, investing in separate accounts. Variable annuity contract values fluctuate and are subject to market risk including the possible loss of principal.
A fixed annuity utilized as an income vehicle generally is a contract that in exchange for a client’s premium an insurance company shall provide an income stream(s) to a client. 

For fixed indexed and variable annuities, JourneyGuide utilizes the guaranteed portion of the income rider as the income stream. For fixed annuities, fixed indexed annuities, and variable annuities, any expenses, and charges, except as set forth below, typically are included by the insurance company when determining the income stream.

Annuity guarantees, including guarantees associated with benefit riders, are subject to the claims-paying ability of the insurance company.

Surrender charges may apply if money is withdrawn before the end of an annuity contract. All withdrawals of tax-deferred earnings are subject to current income tax, and, if made prior to age 59 ½, may also be subject to a 10% federal income tax penalty. The contract, if redeemed, may be worth more or less than the total amount invested. 

Additionally, if purchased within a qualified plan (including an IRA), an annuity will provide no further tax deferral features. All other benefits are available for an additional cost. It is important to weigh the costs against the benefits when adding such options to an annuity contract.

The report is a Snapshot and Does Not Provide Investment, Legal, Tax, or Accounting Advice
JourneyGuide provides a snapshot of a User’s current financial position and can help users to focus on their financial resources and goals, and to create a plan of action. Because the results are calculated over many years, small changes can create large differences in future results. JourneyGuide does not provide investment, legal, tax, or accounting services. 

Nothing herein should be construed as or considered investment, legal, tax, or accounting advice. Before making decisions with investment, legal, tax, or accounting ramifications, Users should consult appropriate professionals for advice that is specific to their situation.

Get a Free Annuity Quote

Term:
Thank You for Your
Annuity Quote Request

Need more immediate assistance?

Call 855‑583‑1104 Email Us Schedule a Call
What to expect
  • We verify details and check top carriers.
  • You’ll get a simple side‑by‑side comparison.
  • Questions? We’re happy to help—no pressure.

Tip: Check spam/promotions if you don’t see our email on time.

Need help sooner or have a quick question?

  • Call us at 855‑583‑1104 (Mon–Fri, 8:30 AM–6:00 PM ET)
  • Or reply to our confirmation email—our licensed specialists are ready to assist.
Call Now Email Us Schedule a Call

What happens next

  1. We verify your information and run current rates across top carriers.
  2. You’ll receive a simple comparison with rates, features, and fees.
  3. If you like, we’ll walk through options and answer questions—no pressure.

Tip: Check your spam or promotions folder if you don’t see our email within the time window.