What Is the Merrill Lynch Strategic Balanced Index (MLSB)?
The Merrill Lynch Strategic Balanced Index (ticker: MLSB) is a volatility-managed, multi-asset index that blends U.S. equities and U.S. Treasury futures using a rules-based allocation. It was created by Bank of America on August 12, 2014, and targets 6% annualized volatility.
The MLSB Index is available exclusively inside Corebridge Financial (formerly AIG) Power Protector Series fixed index annuities, including the Corebridge Power 10 Protector. Here’s how the index works, its historical performance, and whether it’s a good crediting strategy to select.
What Is the MLSB Index?
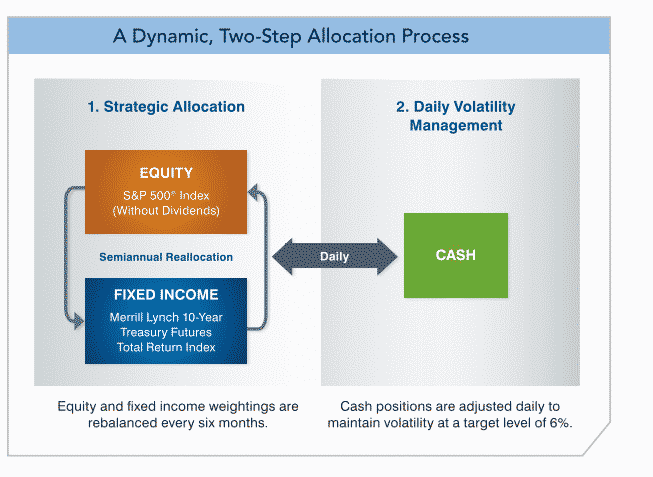
The Merrill Lynch Strategic Balanced Index is a rules-based index that dynamically blends exposure between three asset classes, equities, fixed income, and cash, with the goal of providing stable returns across all types of market conditions.
The two underlying components are:
- S&P 500 Index (without dividends), represents the equity component
- Merrill Lynch 10-Year Treasury Futures Total Return Index, represents the fixed income component
The cash component (used during high-volatility periods) is represented by the 3-month LIBOR rate (now transitioned to SOFR).
Unlike some volatility-controlled indexes that simply adjust leverage on a single asset, the MLSB uses a two-step allocation approach: it first determines the equity/bond split semiannually based on historical volatility, then monitors volatility daily and can shift to cash when short-term volatility exceeds 6%.
How Does the MLSB Index Allocation Work?
The MLSB manages risk through a three-step rules-based process, no human discretion, no emotional decision-making:
- Analyze, Calculate the recent historical volatility of both the S&P 500 and the Treasury futures index
- Determine, Set the equity vs. fixed income weights based on that volatility data. The more volatile an underlying index, the lower its allocation
- Review, Reassess and reallocate the weights every six months
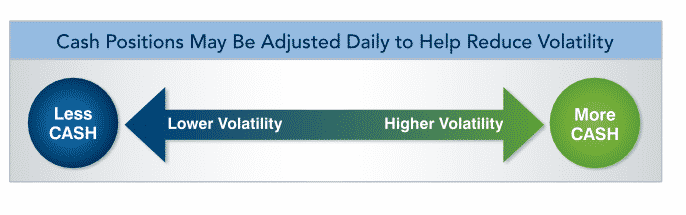
On top of this semiannual rebalancing, the index monitors volatility daily. When short-term volatility rises above the 6% threshold, the combined equity and fixed income allocation can be shifted to cash, up to 100% in extreme conditions. When volatility falls, exposure shifts back from cash into equities and bonds.
This dual-layer approach, semiannual strategic allocation plus daily tactical volatility management, is what sets the MLSB apart from simpler volatility-controlled indexes that only adjust once per day.
How Does It Work Inside a Corebridge Annuity?
You don’t invest directly in the MLSB. Instead, you select it as a crediting strategy inside a Corebridge fixed index annuity. The available crediting method is an annual point-to-point with a participation rate.
Here’s how the math works:
| Detail | Value |
|---|---|
| Crediting Method | Annual Point-to-Point with Participation Rate |
| Participation Rate ($100K+) | 85% |
| Participation Rate (under $100K) | 62% |
| Floor | 0%, no loss if index declines |
Example: If you deposit $100,000 into the Corebridge Power 10 Protector with 100% allocated to the MLSB, and the index returns 10% in a given year, your annuity would be credited 8.5% (10% × 85% participation rate). If the index returns -5%, you get 0%, your principal is protected.
The MLSB is available in several Corebridge Power Protector products. For more on how participation rates and crediting methods work, see our FIA cap rates and participation rates page.
Historical Performance
The MLSB Index was created on August 12, 2014. Data before that date is backtested. The chart below shows annual returns from 1985 through 2020:
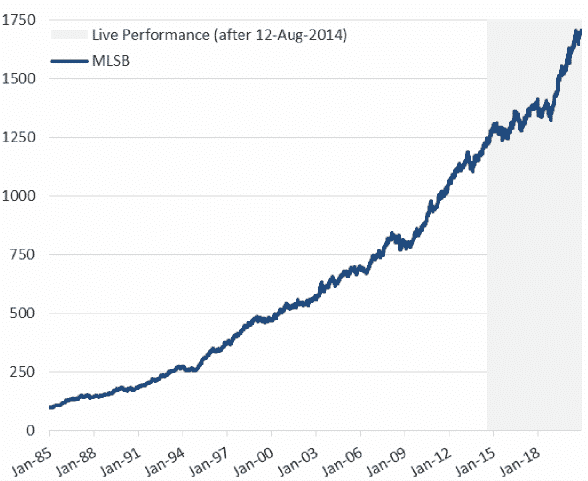
Source: BofA Securities, Bloomberg. Index created 8/12/2014. Data before that date represents hypothetical backtested performance. The index includes a 50bps fee drag and does not include fees or costs of any financial instrument referencing it. Past performance is not indicative of future performance.
Hypothetical Returns Inside a Corebridge Annuity
The table below shows hypothetical interest credited to a Corebridge Power Protector annuity using the MLSB Index across two different 10-year periods, one favorable and one unfavorable:
| Period | Average Annual Return |
|---|---|
| Favorable (12/31/2002 – 12/31/2012) | 5.65% |
| Unfavorable (12/31/2008 – 12/31/2018) | 4.66% |
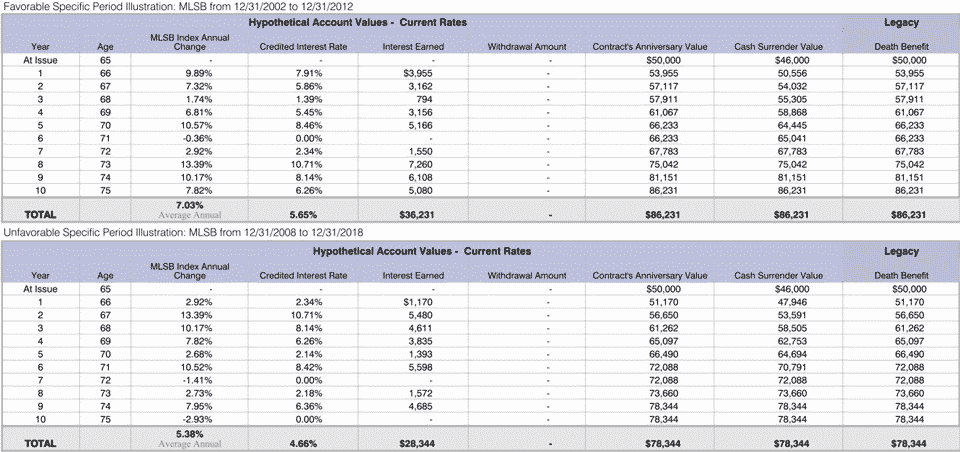
The consistency between the favorable and unfavorable periods (5.65% vs 4.66%) illustrates the MLSB’s core design goal: reducing the gap between best-case and worst-case outcomes through active volatility management.
These are hypothetical illustrations based on backtested data with current participation rates applied retroactively. Actual credited rates depend on the crediting method, caps, and participation rates in effect during any given period. Past results do not guarantee future performance.
MLSB vs. Other Volatility-Controlled Indexes
| Index | Asset Class | Vol Target | Rebalancing |
|---|---|---|---|
| Merrill Lynch Strategic Balanced (MLSB) | Equity + Treasuries | 6% | Semiannual + Daily |
| Bloomberg US Dynamic Balance II | Equity + Bonds | 5% | Daily |
| Nasdaq FC (BOFANFCC) | Equity only (Nasdaq-100) | 12.5% | Hourly |
| S&P 500 Daily Risk Control 5% | Equity only (S&P 500) | 5% | Daily |
The MLSB sits in the moderate range, it’s more conservative than the equity-only Nasdaq FC (12.5% vol target with up to 175% leverage) but slightly more aggressive than the Bloomberg Dynamic Balance II (5% target). Its unique semiannual + daily rebalancing approach provides a different risk management profile: the semiannual review sets the strategic allocation, while daily monitoring acts as a tactical overlay for sudden volatility spikes.
Three Key Features of the MLSB Index
1. Rules-Based Allocation
The MLSB uses a purely quantitative, rules-based approach to determine the equity/bond split. There’s no human fund manager making allocation calls, it’s entirely systematic. This eliminates emotional biases from allocation decisions and makes the process transparent and objective.
2. Semiannual Strategic Rebalancing
Every six months, the index analyzes the historical volatility of both the S&P 500 and the Treasury futures index and adjusts the weights accordingly. When equity volatility is elevated, the allocation shifts toward Treasuries. When equity markets are calm, more weight goes to stocks.
3. Daily Volatility Management
In addition to the semiannual review, the MLSB monitors volatility daily. When short-term volatility exceeds 6%, the equity and fixed income allocation can be shifted to cash, up to 100% during extreme conditions like a market crash. This provides an additional layer of protection that the semiannual rebalancing alone can’t capture.
Which Annuities Offer the MLSB Index?
The MLSB Index is available exclusively in Corebridge Financial (formerly AIG/American General) Power Protector Series annuities:
- Corebridge Power 10 Protector, 10-year FIA with income rider option
For Corebridge’s full product lineup, financial ratings, and company overview, see our Corebridge Financial Annuity Review.
Should You Choose the MLSB Index in Your Annuity?
The MLSB is a good fit if you:
- Want a balanced equity/bond approach, you’d rather have automatic diversification than pure equity exposure
- Value consistency over maximum upside, the 4.66%–5.65% hypothetical range shows relatively tight best/worst outcomes
- Prefer a longer track record, backtested data goes back to 1985, and the index has been live since 2014 (longer than many competing vol-controlled indexes)
- Are using a Corebridge Power Protector product, since the MLSB is exclusive to Corebridge, it’s only relevant if you’re already looking at that product line
If you’re looking for higher growth potential and are comfortable with more volatility, consider an annuity that offers the Nasdaq FC Index (12.5% vol target, hourly rebalancing, available in Athene products). For a similar multi-asset approach in an Allianz annuity, the Bloomberg US Dynamic Balance II serves a comparable role.
Not sure which product or index strategy is right for your situation? Request a free quote and we’ll help you compare.
Frequently Asked Questions
What is the MLSB Index?
The Merrill Lynch Strategic Balanced Index (MLSB) is a volatility-managed index created by Bank of America that blends S&P 500 equities and 10-Year Treasury futures using a rules-based allocation process. It targets 6% annualized volatility and can shift to cash during extreme market conditions. It’s used as a crediting strategy inside Corebridge Financial fixed index annuities.
Can you lose money with the MLSB Index in an annuity?
No, if the MLSB finishes an annual crediting period negative, your annuity is credited 0%. Your principal is protected from market losses. However, early withdrawals may be subject to surrender charges, which could reduce your overall value.
Why is the participation rate lower than 100%?
The insurance carrier purchases options on the MLSB to fund your crediting strategy. The participation rate reflects how much of the index return they can pass through after accounting for the cost of those options, expenses, and the downside protection guarantee. At 85% for premiums of $100K+, the MLSB participation rate is competitive for a multi-asset index. For more on how this works, see our FIA beginner’s guide.
Is the MLSB exclusive to Corebridge/AIG?
Yes. The Merrill Lynch Strategic Balanced Index is available only inside Corebridge Financial (formerly AIG/American General) Power Protector Series fixed index annuities. You won’t find it offered by Athene, Allianz, Nationwide, or other carriers.
How does the MLSB compare to the Bloomberg Dynamic Balance II?
Both are multi-asset indexes blending equities and bonds with a rules-based approach. The MLSB targets 6% volatility with semiannual + daily rebalancing, while the Bloomberg Dynamic Balance II targets 5% with daily-only rebalancing. The MLSB uses Treasury futures for its bond component, while the Bloomberg index uses the broader U.S. Aggregate Bond Index. Both produce relatively consistent returns with lower drawdowns than equity-only indexes.


